
How the MITRE ATT&CK Navigator Maps Tactics to Detection
The Navigator does not analyze traffic; it structures human judgment into a visual grid that forces teams to confront specific gaps in their detection logic.
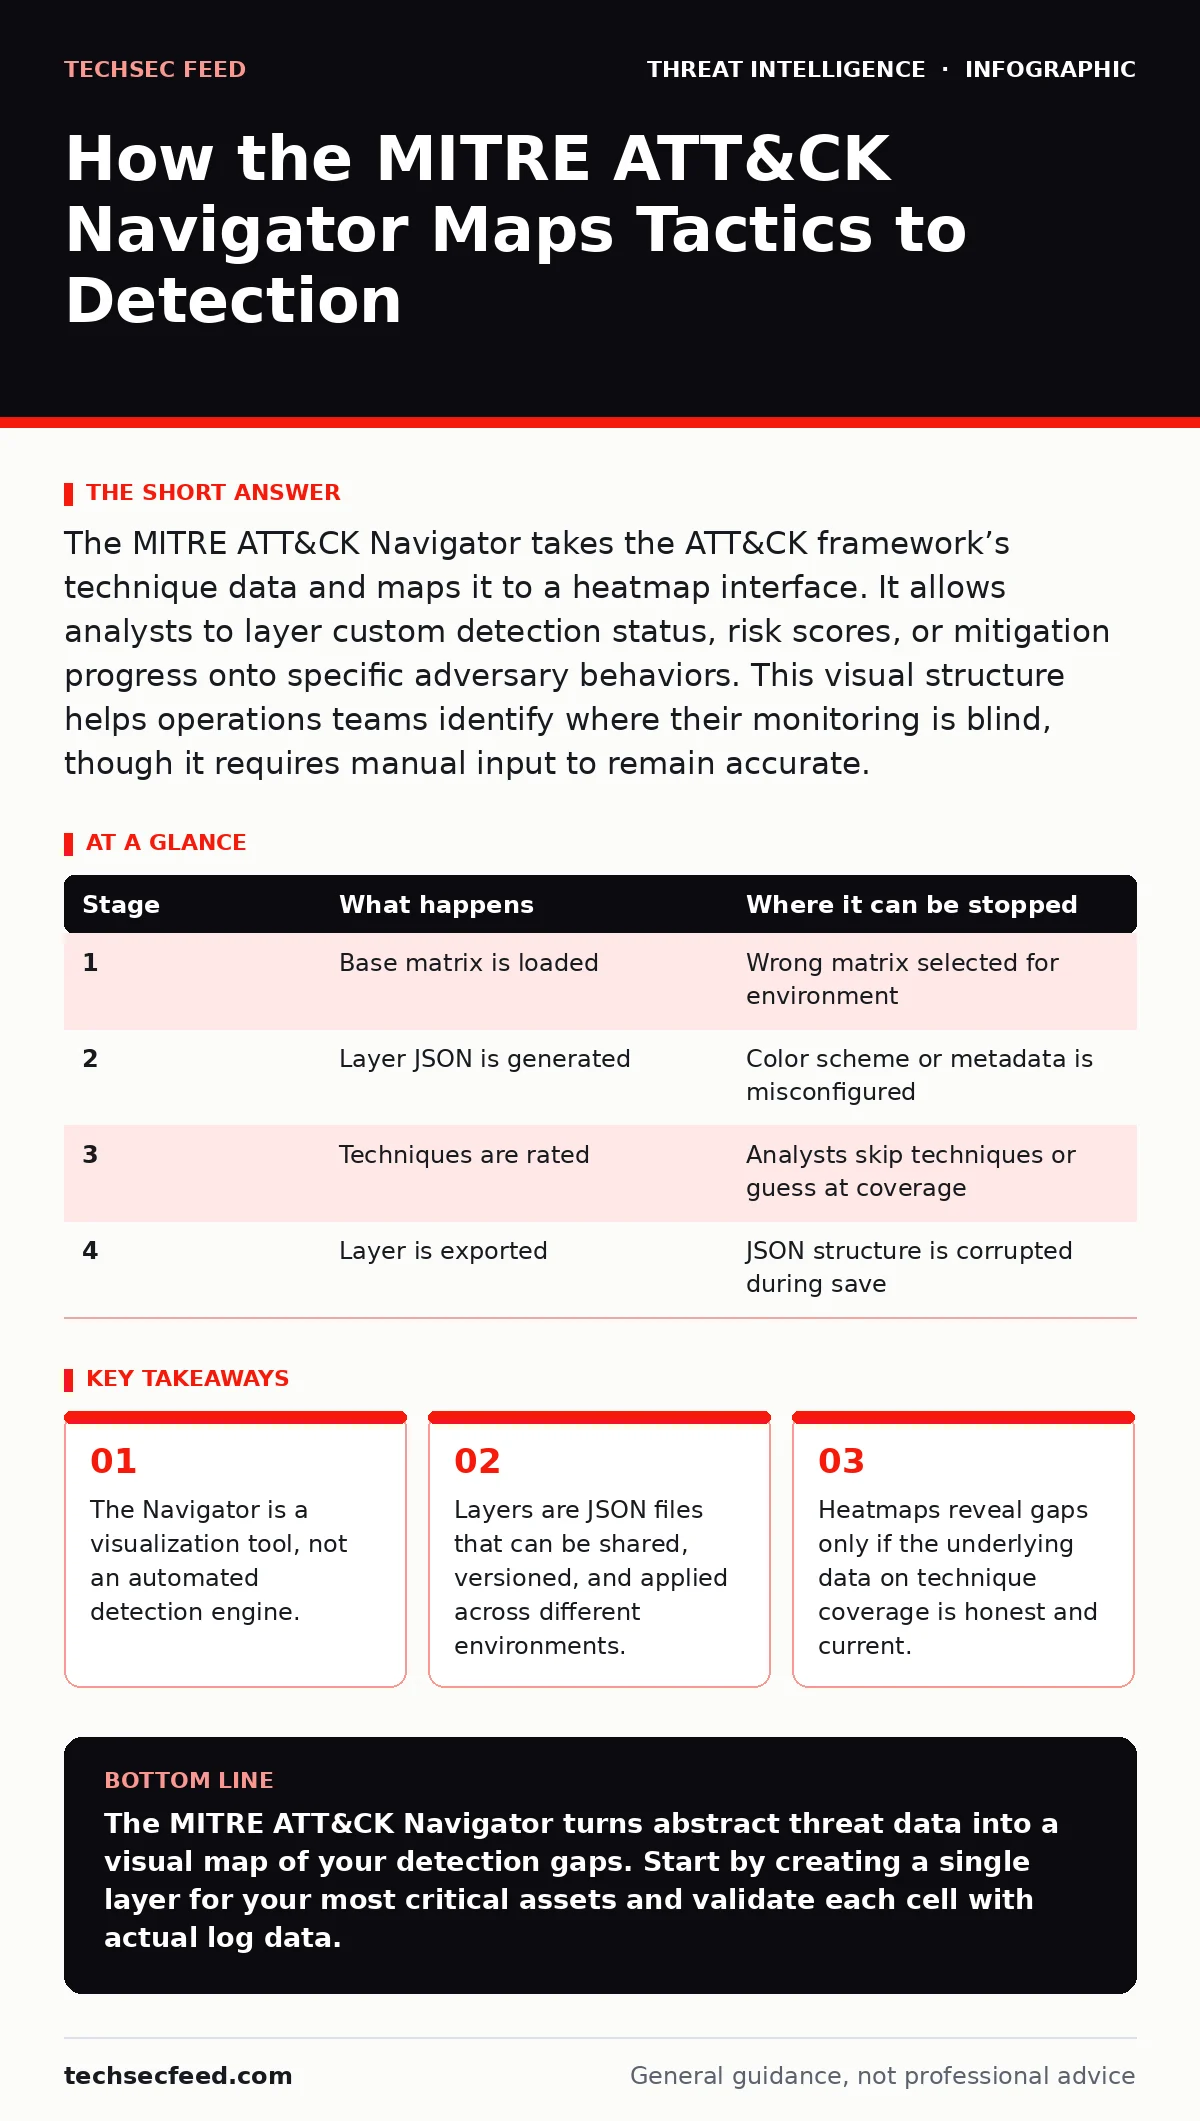
The MITRE ATT&CK Navigator takes the ATT&CK framework’s technique data and maps it to a heatmap interface. It allows analysts to layer custom detection status, risk scores, or mitigation progress onto specific adversary behaviors. This visual structure helps operations teams identify where their monitoring is blind, though it requires manual input to remain accurate.
Understanding the Navigator’s Core Mechanism
The MITRE ATT&CK Navigator is a web-based application that visualizes the ATT&CK framework. It does not connect to your network sensors. It does not parse logs. Instead, it provides a grid where each cell represents a specific adversary technique. You overlay data onto this grid to create a heatmap.
This heatmap shows where your organization stands against known tactics. A red cell might indicate a high-risk technique you cannot detect. A green cell might show a technique you have fully mitigated. The tool transforms abstract threat data into a concrete operational map.
Stage 1: Base Matrix Selection
The process begins with selecting a base matrix. The ATT&CK framework has separate matrices for Enterprise, Mobile, ICS, and PRE-ATT&CK. You must choose the matrix that matches your environment. Selecting the wrong matrix creates a map that is useless for your specific infrastructure.
Most organizations start with the Enterprise matrix. It covers the widest range of common adversary behaviors. Once selected, the Navigator loads the full list of tactics and techniques relevant to that domain. This list is static in the sense that it reflects a specific version of the framework.
Stage 2: Layer Creation and Configuration
You create a new layer to record your observations. A layer is a JSON object that holds metadata and cell states. You define the layer’s name, author, and color scheme. The color scheme determines how the heatmap renders. You might assign red to "High Risk" and green to "Covered."
Behind the scenes, the Navigator generates a unique identifier for the layer. This identifier allows you to export the configuration. You can save this configuration as a file. This file contains no sensitive data, only the status of techniques. It is safe to share internally or with partners.
Stage 3: Mapping Techniques to Status
This stage requires manual or semi-automated input. You click on technique cells and assign them a status. You might mark a technique as "Detected," "Not Detected," or "Mitigated." You can also add comments to explain why a status was chosen.
This step is where the tool adds value. It forces you to evaluate every technique individually. You cannot claim coverage of "Initial Access" as a whole. You must evaluate "Phishing" and "Valid Accounts" separately. This granularity reveals the true state of your defenses.
| Stage | What happens | Where it can be stopped |
|---|---|---|
| 1 | Base matrix is loaded | Wrong matrix selected for environment |
| 2 | Layer JSON is generated | Color scheme or metadata is misconfigured |
| 3 | Techniques are rated | Analysts skip techniques or guess at coverage |
| 4 | Layer is exported | JSON structure is corrupted during save |
Stage 4: Integration with Detection Tools
The Navigator does not scan your systems. You must determine coverage through other means. You might review your Sysmon configuration to see if it captures specific process creations. You might check if your Snort and Suricata rules include signatures for a given technique.
Imagine you are evaluating the "Scheduled Task/Job" technique. You check your endpoint logs. You find no evidence of monitoring for new task creations. You mark this cell as "Not Detected" in the Navigator. This manual correlation is the hidden cost of using the tool. It requires deep technical knowledge of your own stack.
See also: ASN Threat Intelligence: Small Business Network Defense · How Small Businesses Use ISACs for Threat Intelligence
Stage 5: Sharing and Version Control
Layers are designed to be shared. You can export a layer as a JSON file or share a public link. This allows different teams to work on the same map. One team might focus on "Execution," while another focuses on "Exfiltration."
Sharing layers helps standardize terminology. If two teams disagree on what "Detected" means, the heatmap becomes meaningless. You must agree on definitions before sharing. This social aspect is often harder than the technical setup.
Stage 6: Identifying Gaps and Blind Spots
The final stage is analysis. You look for clusters of red cells. These clusters indicate areas where adversaries can operate freely. You might find that you have strong detection for "Initial Access" but poor detection for "Lateral Movement."
This visualization helps prioritize work. Instead of adding random detections, you target the gaps that matter most. You might decide to implement canary tokens in a directory that is currently a blind spot. This targeted approach is more efficient than broad monitoring.
Limits of the Navigator Approach
The Navigator has inherent limits. It relies on the quality of your input. If you mark a technique as "Detected" when you are not sure, the map lies to you. It creates a false sense of security.
It also does not account for context. A technique might be detected in one part of the network but not another. The Navigator treats the organization as a single unit. You may need multiple layers to represent different environments accurately.
Combining with Other Intelligence Sources
The Navigator works best when combined with other sources. You might use data from ISACs to identify which techniques are currently active in your industry. You might cross-reference with reports on nation-state cyber attacks to see which tactics are trending.
This external context helps you prioritize. You might focus on command and control traffic detection if you see a rise in that technique among your peers. The Navigator provides the structure; your intelligence provides the urgency.
Key takeaways
- The Navigator is a visualization tool, not an automated detection engine.
- Layers are JSON files that can be shared, versioned, and applied across different environments.
- Heatmaps reveal gaps only if the underlying data on technique coverage is honest and current.
The MITRE ATT&CK Navigator turns abstract threat data into a visual map of your detection gaps. Start by creating a single layer for your most critical assets and validate each cell with actual log data.
Frequently asked questions
Can the MITRE ATT&CK Navigator automatically detect threats?
No, the Navigator is a visualization tool. It requires manual input or integration with other tools to populate data about detection coverage.
How often should I update my ATT&CK layers?
Update layers whenever your detection capabilities change. This includes new rules, sensors, or mitigation controls. Quarterly reviews are a common baseline.
Can I share my ATT&CK layers with other organizations?
Yes, layers are JSON files and can be shared. However, ensure you do not include sensitive comments or internal details in the exported file.
Does the Navigator cover cloud environments?
Yes, the Enterprise matrix includes cloud-specific techniques. You should select the appropriate matrix and map cloud-specific controls to the relevant techniques.
How this guide was produced: written by the TechSec Feed editorial team with AI assistance, checked against the public references listed below, and reviewed when the facts change. See our editorial policy or report an error.