
Detecting iOS Zero-Click Exploits: Logs, Signals and Blind Spots
Zero-click attacks leave no user interaction trace, forcing defenders to hunt for anomalous resource consumption and unexpected process spawns in system telemetry.
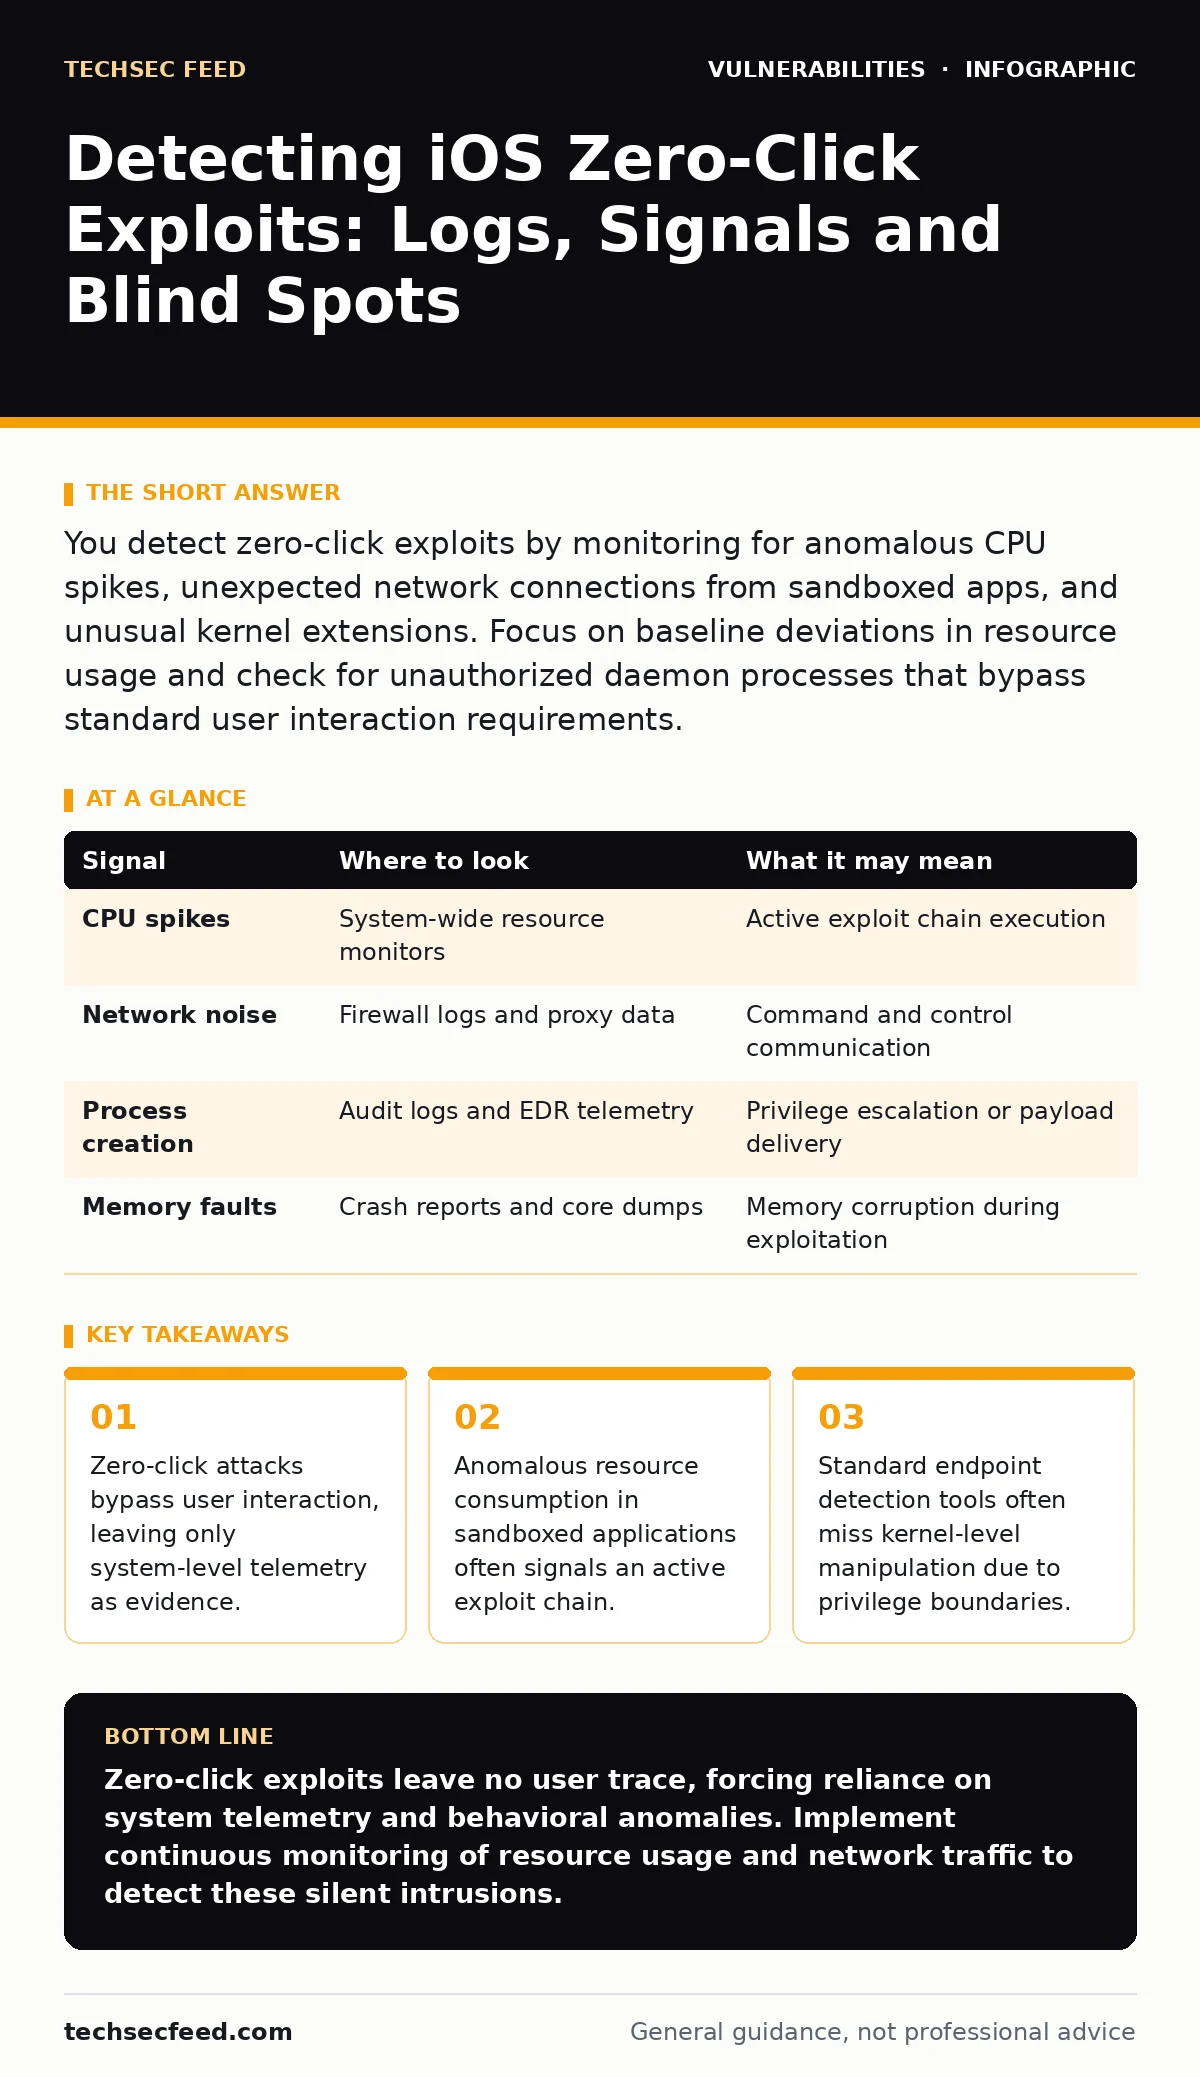
You detect zero-click exploits by monitoring for anomalous CPU spikes, unexpected network connections from sandboxed apps, and unusual kernel extensions. Focus on baseline deviations in resource usage and check for unauthorized daemon processes that bypass standard user interaction requirements.
Understanding the Zero-Click Mechanism
Zero-click vulnerabilities allow an attacker to execute code on a device without any user interaction. The exploit chain typically begins with a crafted message or file that the operating system processes automatically. This processing triggers a memory corruption bug or logic error within a system service. The attacker then leverages this error to gain code execution privileges. Unlike phishing attacks, there is no click to trace. The entire sequence happens in the background. You must look for the side effects of this execution rather than the trigger itself.
Resource Consumption Anomalies
Exploit chains consume significant computational resources. The initial parsing of malicious data requires CPU cycles. Subsequent steps, such as heap spraying or return-oriented programming (ROP) chains, increase this load. You should monitor for sustained high CPU usage from background services. Look for processes that spike in activity shortly after receiving a message. Battery drain is a secondary indicator of this high resource consumption. If a messaging app consumes excessive power while idle, investigate the underlying processes. These anomalies often precede full compromise.
| Signal | Where to look | What it may mean |
|---|---|---|
| CPU spikes | System-wide resource monitors | Active exploit chain execution |
| Network noise | Firewall logs and proxy data | Command and control communication |
| Process creation | Audit logs and EDR telemetry | Privilege escalation or payload delivery |
| Memory faults | Crash reports and core dumps | Memory corruption during exploitation |
Network Telemetry Indicators
Network traffic provides the clearest external signal of a compromise. Once the exploit executes, the malware often needs to communicate with a command and control server. This communication may appear as unusual outbound connections. Check for connections from sandboxed applications that do not normally initiate outbound traffic. Look for connections to non-standard ports or newly registered domains. DNS query patterns can also reveal exfiltration attempts. Sudden increases in DNS resolution for a specific app indicate data movement. Correlate these network events with the timestamp of message receipt.
Process and Memory Forensics
System processes reveal the internal state of the device. Attackers often spawn new processes to maintain persistence or escalate privileges. You should audit process trees for unexpected children of system services. Look for processes that run with higher privileges than their parent. Memory forensics can reveal injected code that does not appear in process lists. Core dumps from crashed services may contain traces of the exploit payload. Analyze these dumps for unusual stack traces or memory addresses. This analysis requires specialized tools and expertise.
Kernel and Driver Analysis
Some exploits target the kernel to bypass security controls. Kernel exploits are harder to detect because they operate at a high privilege level. Look for unsigned kernel extensions or drivers that load unexpectedly. Monitor for changes to kernel memory protection settings. These changes often indicate an attempt to disable security mechanisms. Check for modifications to system call tables. Any deviation from the expected kernel state warrants immediate investigation. Kernel-level activity is often invisible to standard user-space monitoring tools.
See also: GraphQL Vulnerabilities: 9 Critical Questions Answered · Asset Inventory Mistakes That Break Patching Workflows
Common Blind Spots in Detection
Many security teams miss zero-click exploits due to inherent blind spots. The first blind spot is the assumption that user interaction is required for compromise. This assumption leads to monitoring gaps in background processes. The second blind spot is the reliance on signature-based detection. Zero-click exploits often use custom payloads that do not match known signatures. The third blind spot is the lack of visibility into sandboxed applications. Many tools cannot inspect the internal state of sandboxed processes. Addressing these blind spots requires a shift to behavior-based detection.
Recommended Detection Tools
Effective detection requires a combination of tools. Endpoint detection and response (EDR) platforms provide process and network visibility. Look for EDR solutions that offer deep kernel visibility. Network intrusion detection systems (NIDS) can identify suspicious outbound traffic. Memory forensics tools help analyze core dumps and running processes. These tools must be integrated to provide a complete picture. Correlation between network events and process behavior is critical. No single tool provides complete coverage of all attack vectors.
Mitigation and Response Strategies
Detection is only the first step in handling zero-click exploits. Once detected, immediate isolation of the affected device is necessary. Preserve forensic evidence before wiping the device. Analyze the evidence to understand the attack vector. Update systems to patch known vulnerabilities. Implement strict application sandboxing to limit blast radius. Consider using memory-safe programming languages for critical system components. These languages reduce the likelihood of memory corruption bugs. Regularly review your detection rules for coverage gaps.
RELATED GUIDES:
- See our guide on memory-safe programming languages for strategies to reduce vulnerability surfaces.
- Refer to software bill of materials (SBOM) documentation for tracking component vulnerabilities.
- Review EPSS percentiles to prioritize patching efforts based on exploit probability.
Key takeaways
- Zero-click attacks bypass user interaction, leaving only system-level telemetry as evidence.
- Anomalous resource consumption in sandboxed applications often signals an active exploit chain.
- Standard endpoint detection tools often miss kernel-level manipulation due to privilege boundaries.
Zero-click exploits leave no user trace, forcing reliance on system telemetry and behavioral anomalies. Implement continuous monitoring of resource usage and network traffic to detect these silent intrusions.
Frequently asked questions
Can mobile device management (MDM) tools detect zero-click exploits?
MDM tools can enforce security policies and isolate devices, but they rarely provide deep telemetry needed to detect active exploit chains.
How long do zero-click exploits remain active before detection?
Detection time varies based on monitoring maturity; without behavioral analytics, these exploits can remain active indefinitely.
Do jailbroken devices offer better visibility into zero-click attacks?
Jailbreaking removes security controls, making exploitation easier and detection more complex due to altered system behavior.
Is network segmentation effective against zero-click exploits?
Network segmentation limits lateral movement but does not prevent the initial exploitation or command and control communication.
How this guide was produced: written by the TechSec Feed editorial team with AI assistance, checked against the public references listed below, and reviewed when the facts change. See our editorial policy or report an error.